In past issues we discussed how we can analyze the volatile computer memory with Lime Forensics and Volatility for system structures and applications in memory and, consequently, the information they store. However, there are other easier and faster to capture the data in the device memory ways.
Data collection in memory
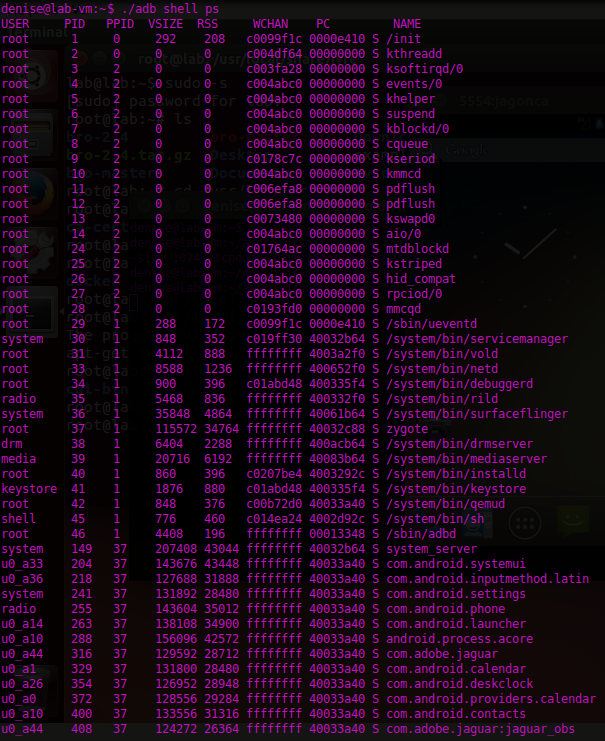
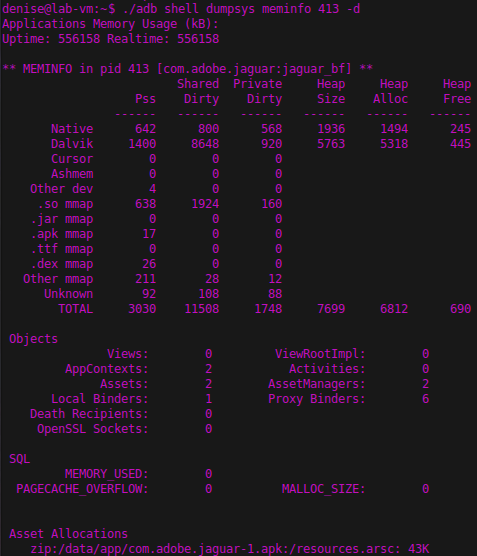
An option to easy data collection is the use of the Android Debug Bridge ( adb ) to list information concerning the processes, network connections, log files, and so on. Through the adb shell & lt command; ps | netstat | logcat | backup | dumpsys & gt; , the analyst can access the shell team to dump data from the system files.


You can also view the different memory allocations affecting a particular application, returning information Dalvik both memory as ART.

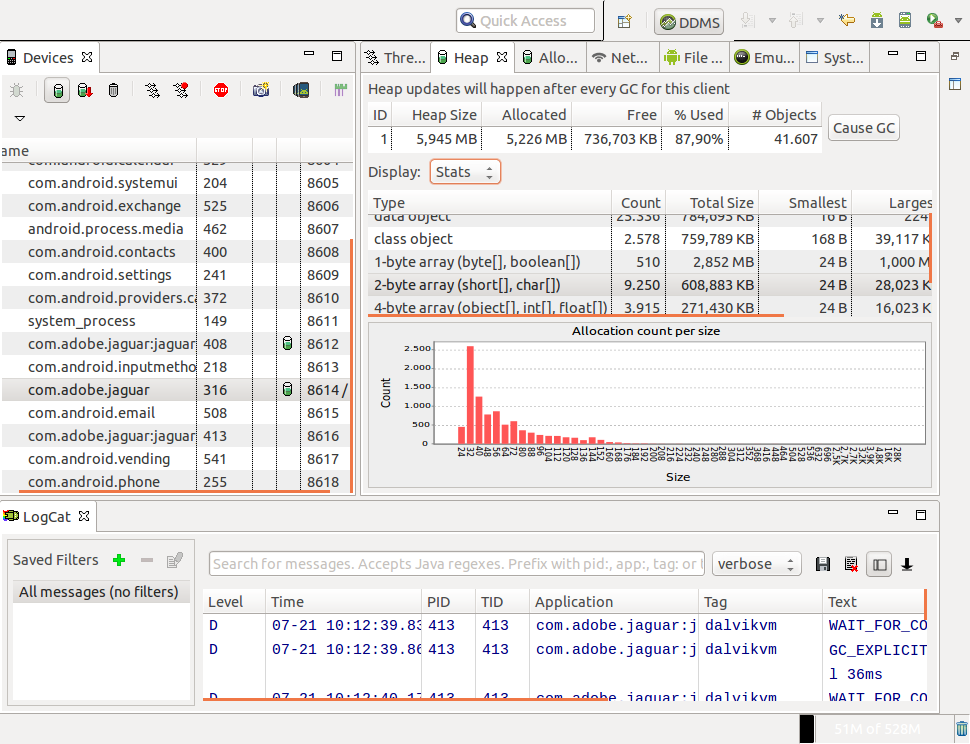
An alternative for collecting this type of data is to use the Dalvik Debugging Monitor Server ( DDMS ) using the Android Device Monitor . This tool can be initialized by running the & lt file; ruta_sdk & gt;. / Tools / monitor
With it we can see updates in the stack memory, cause the execution of the GC, or perform track memory allocations between different active objects. Also we can access the messages generated by the application and the system through LogCat to usage statistics and network file system present on the device.

A simple method to dump the contents of the memory of a running process using DDMS is to create a HPROF . To do this, we just need to select the process and click on the “DUMP HPROF file” option. If necessary, the creation of this file can be programmed from the application using the method dumpHprofData () .

To analyze the resulting file is necessary to first convert it to format J2SE HPROF using the & lt tool; ruta_sdk & gt; / platform-tools / hprof-conv . This, only if we have not used the Android Device Monitor embedded in Eclipse.
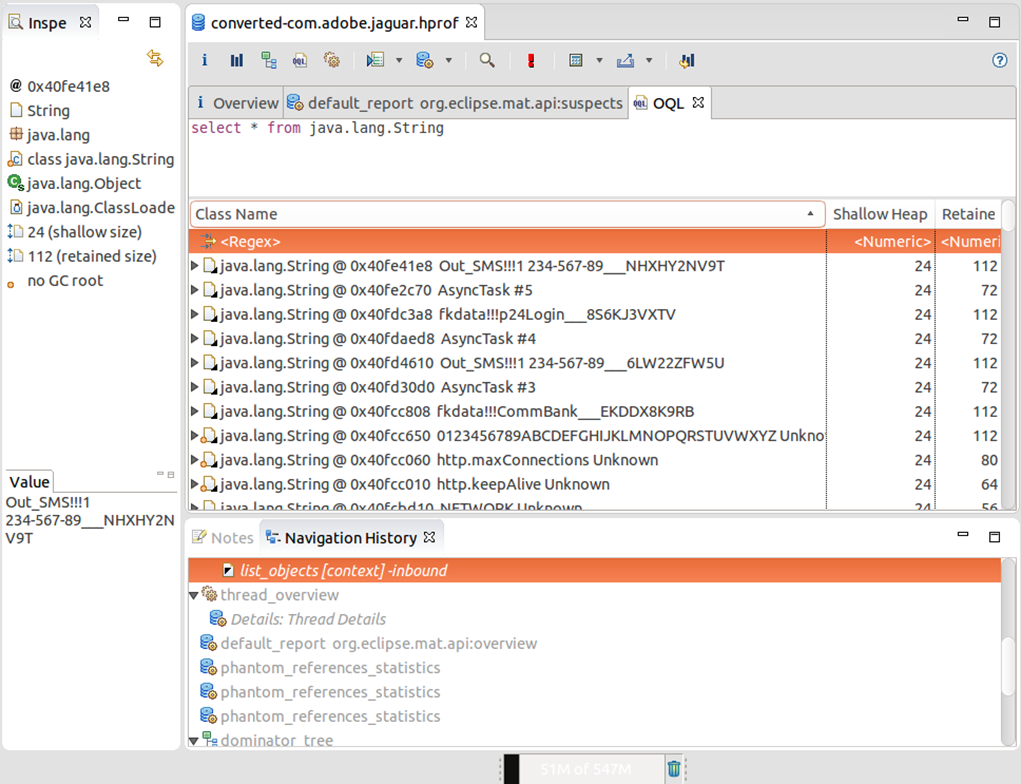
Finally, we can analyze the memory dump with the Eclipse Memory Analyzer Tool ( Math ) or any other analyzer memory of our choice. Among other things, we can analyze strings locked in objects of type String that are active in memory; for this, we can enter the query “ select * from java.lang.String ” in the Object Query Language studio Eclipse MAT.
In the image presented below can be seen some of the messages sent by a bot to the C & C via HTTP, as can be found fragments of SMS messages and email that were still in memory terminal.

The great handicap memory analysis with DDMS is that to access some statistics the application needs to be refined; ie their manifest need to file the android: debuggable with a boolean true to instruct the system to open a debug port. To overcome this limitation, it is always possible to alter the APK
NOTE:. To read more about debugging memory, go to the Android developer documentation
As we saw …
Get real-time computer memory can be a very simple process using the analysis tools included in the kit platform development . The use of these utilities originally designed to evaluate application performance becomes essential in the analysis of ever-changing malicious code.
The ability to recover files from memory, data in plain text, history web browsing, SMS messages, emails, contacts, and DEX APK files installed on the system, it is essential not only to generate a complete forensic profile of the team, but also to analyze how they change samples malware capable of dynamically mutate.
Author Denise Giusto Bilić, We Live Security
No comments:
Post a Comment